
From 20 May 2026 to 12 June 2026, the Monopolies Commission published daily updated analyses here on the trend in fuel prices following the introduction of the fuel rebate. The data is based on the previous day’s figures. The charts show how prices in Germany are developing in comparison with France and the UK, and to what extent the tax cut is being passed on to consumers. The analyses are continuously updated, enabling ongoing monitoring of price trends over time.
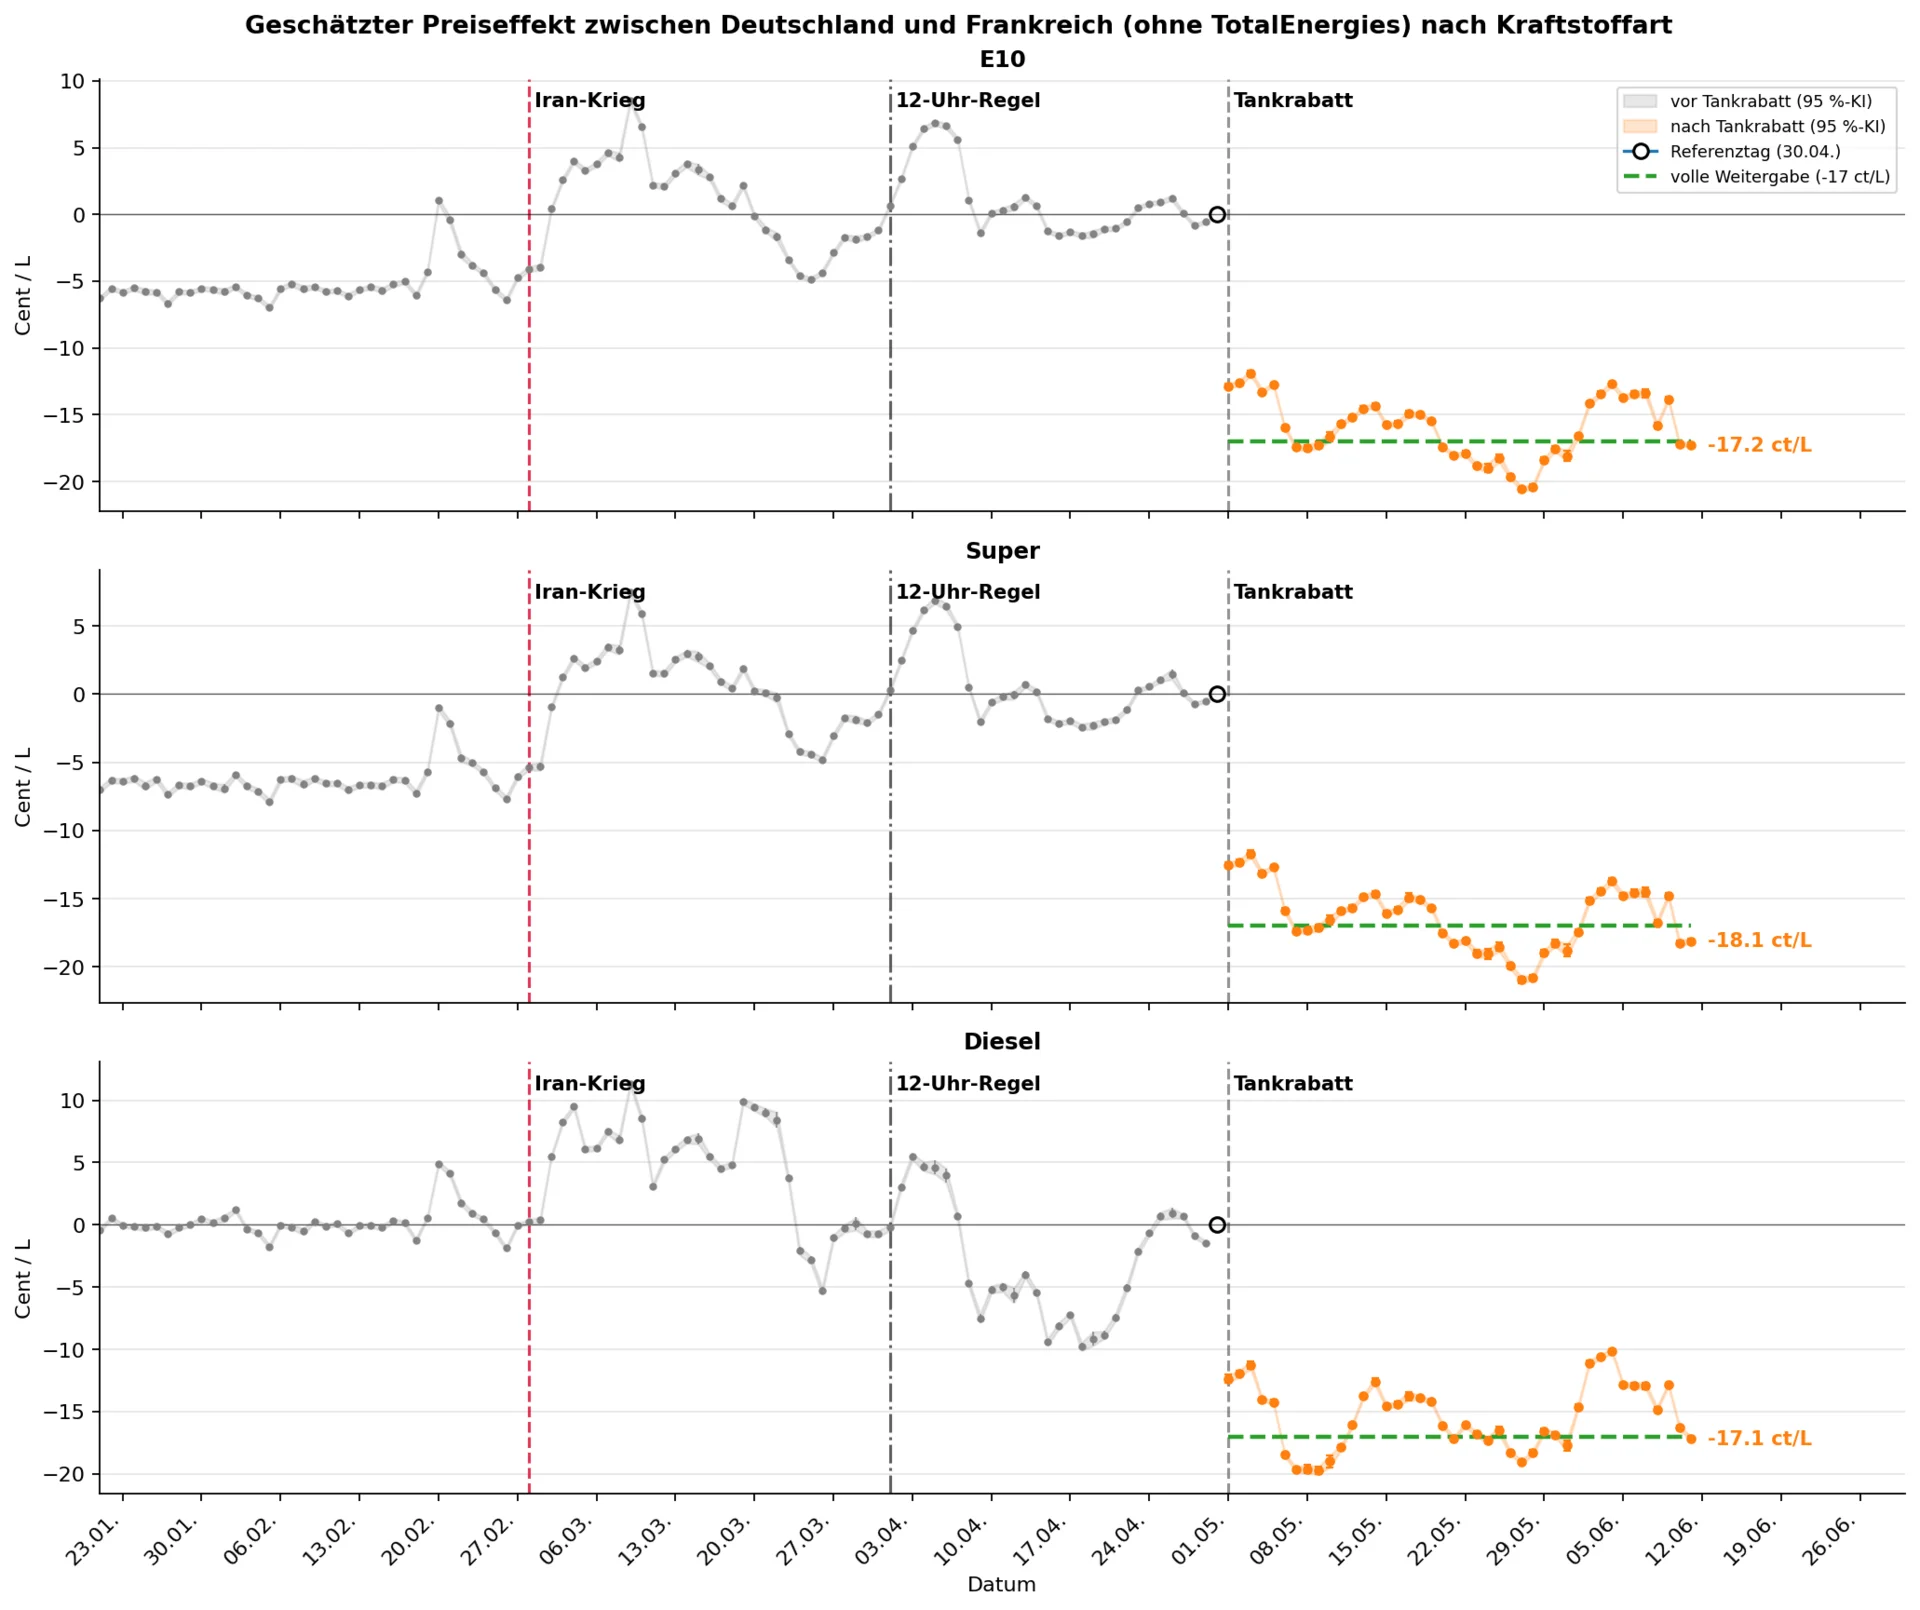
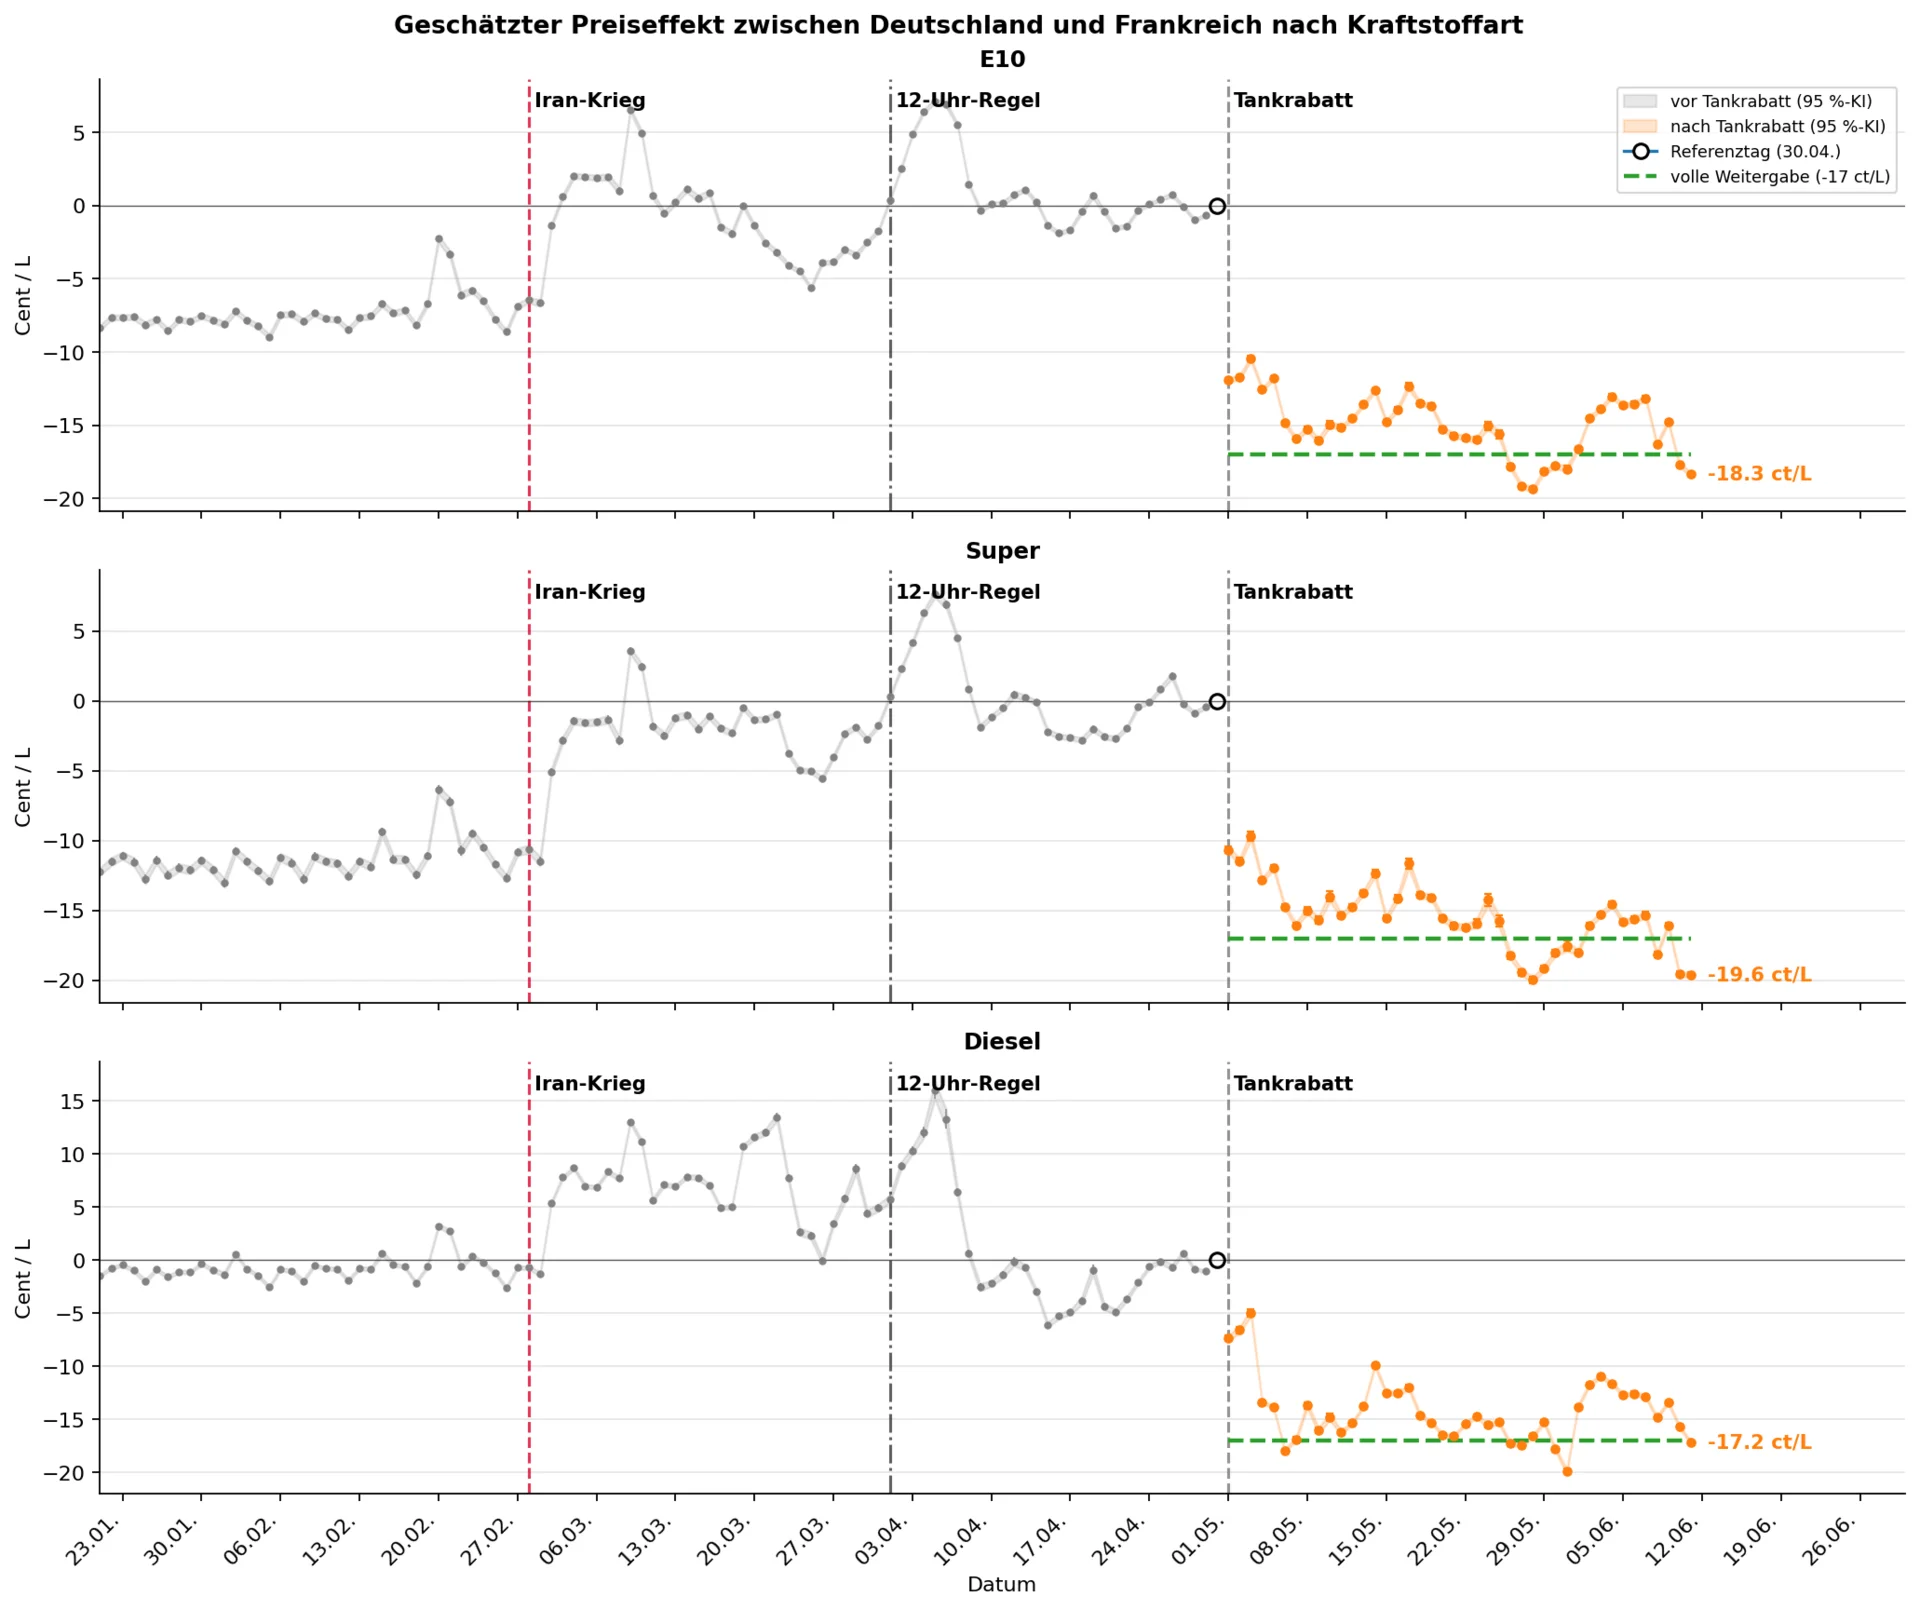
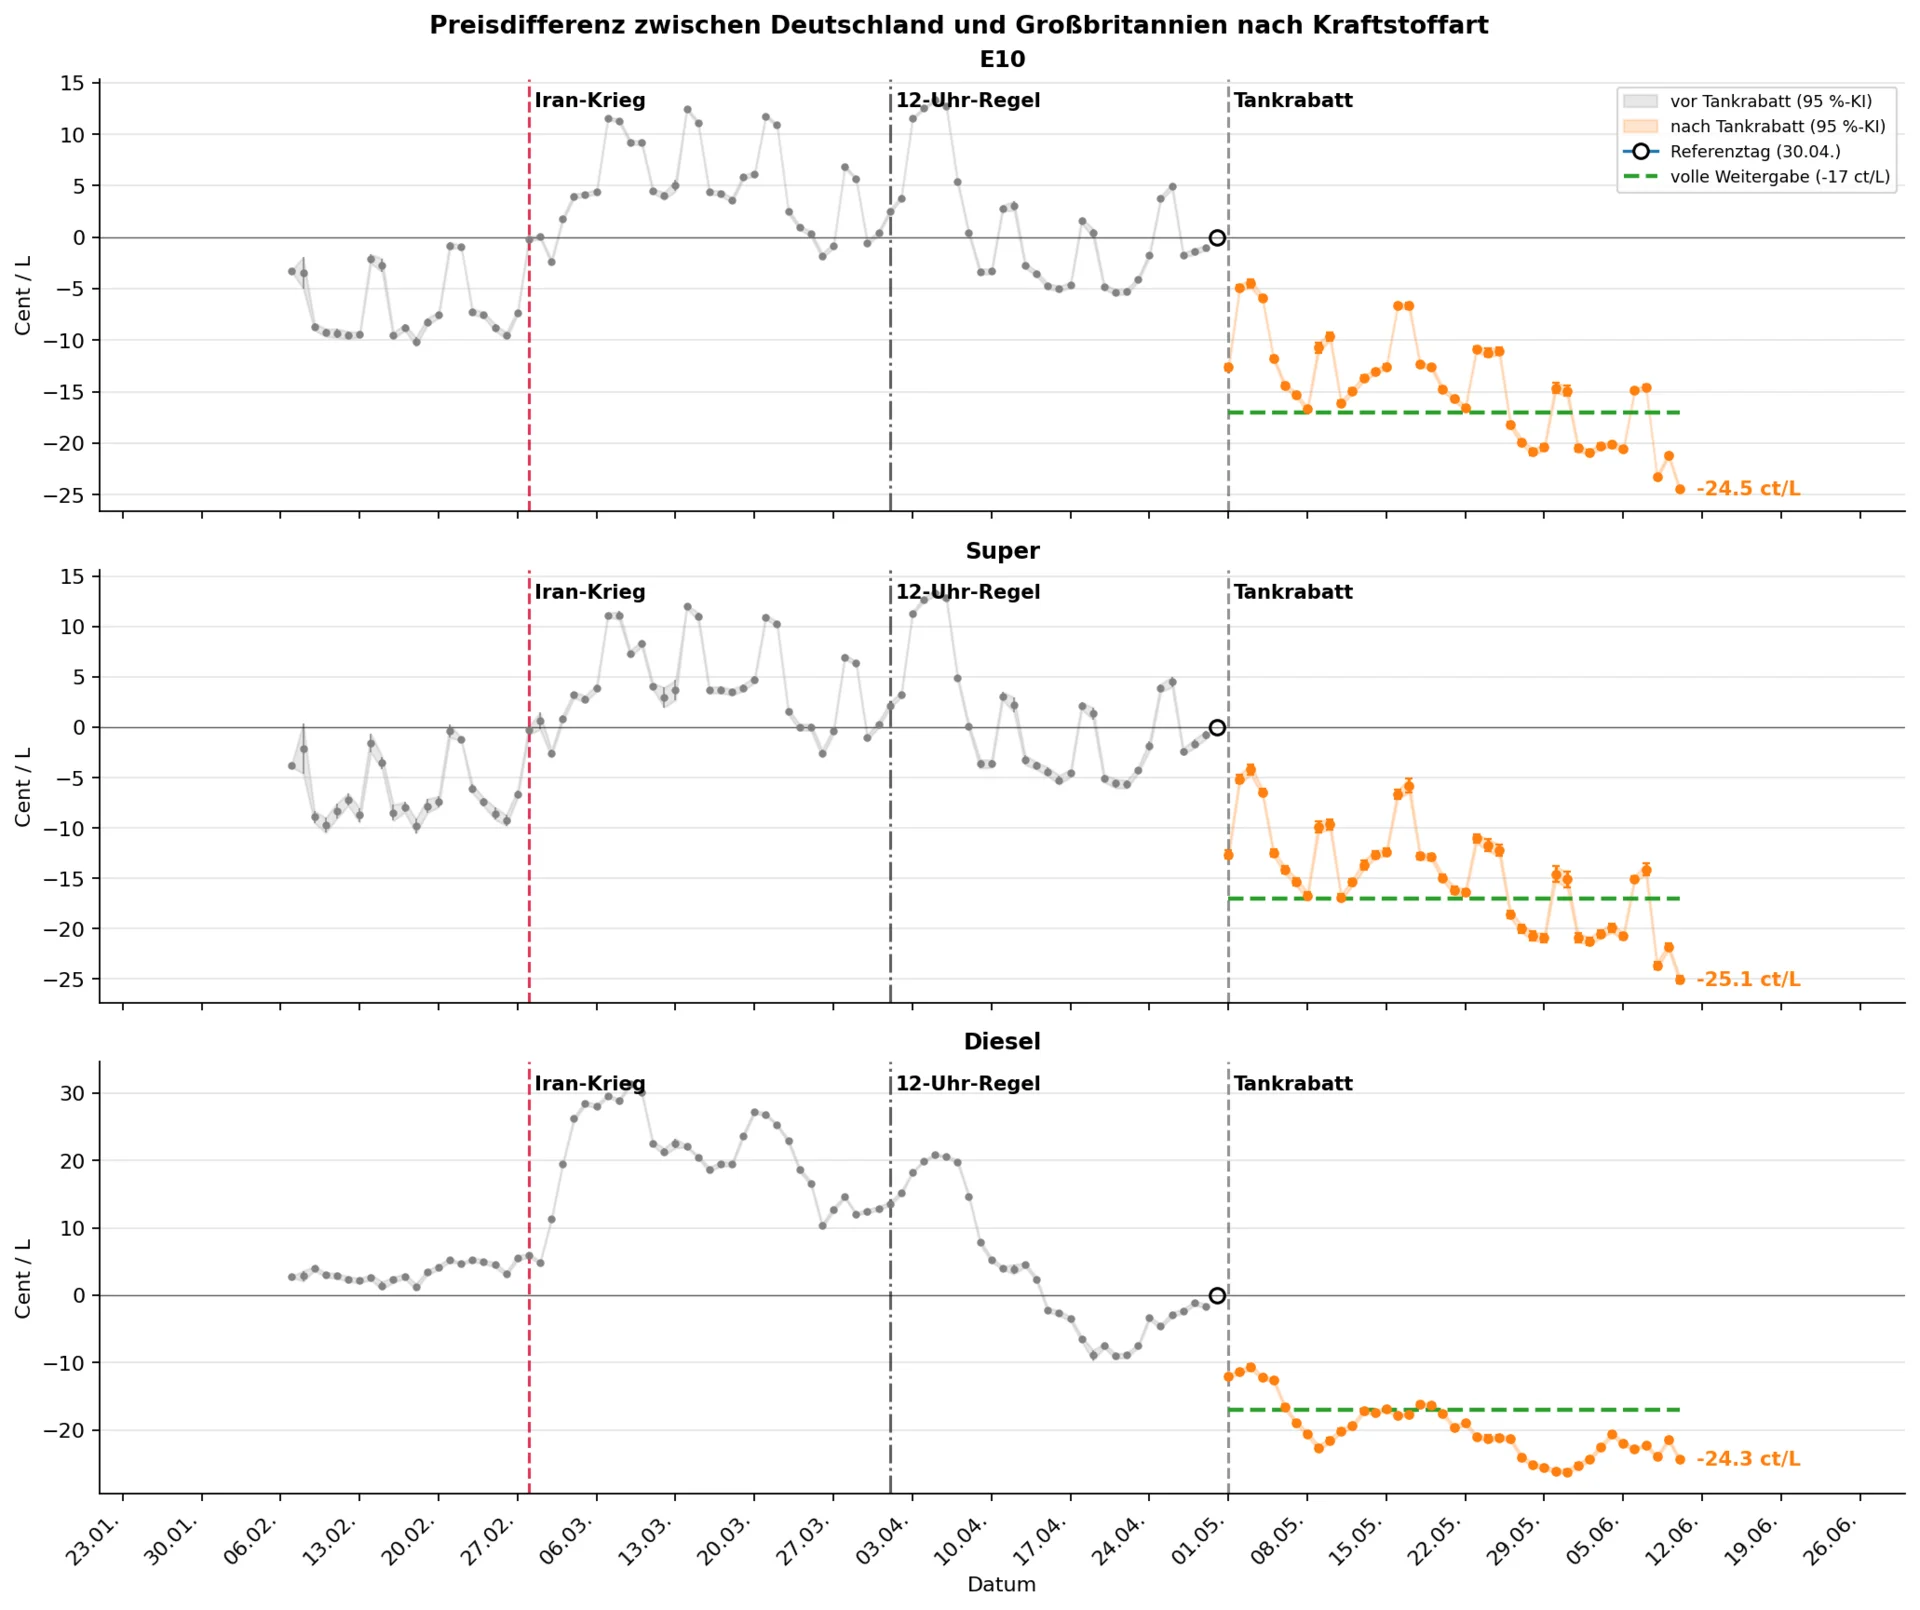
The charts illustrate different but interrelated aspects of price trends. Whilst the analyses of the fuel rebate illustrate the pass-through of the tax cut (shown in orange), the grey lines relating to the period before the outbreak of the war and the introduction of the ‘12 o’clock rule’ help to better contextualise general market trends. It is only when viewed as a whole that a more complete picture emerges of the factors that have influenced fuel prices in Germany.
Policy Brief
Graphs
Methodology
We compare daily price trends in Germany with those in France and the UK, which serve as control markets. France is our primary control group because its fuel market is structured similarly and has experienced the same crude oil price shock as the German market. To assess whether, and to what extent, the fuel rebate is actually being passed on to consumers, we use a so-called difference-in-differences approach. In doing so, we examine how the price differences between Germany and France have changed before and after the introduction of the fuel rebate. Price trends in France serve as a reference for how prices in Germany would likely have developed without the fuel rebate. We exclude Total petrol stations from the French comparison because Total has introduced a self-imposed price cap in recent weeks, which would distort the comparability. The comparison with the UK serves as an additional robustness test.